
Kinetic Energy Distribution
When we move from the world of the atom to the world we occupy we must recognize that we are dealing with huge numbers of atoms and molecules, not just one or two. With these huge numbers we are forced to rely on statistics since there is no longer any way that we can calculate the behavior and interactions of all of the molecules in even a very small collection. Ludwig Boltzmann and James Clerk Maxwell contributed to the science of statistical thermodynamics in which we examine the properties of very large numbers of molecules. While we recognize that we can't predict the behavior of any one molecule with any precision, we can quite exactly predict the behaviors of large assemblages of molecules. This is, of course, the same logic used in predicting electron results, disease incidence, and probabilities of failure of parts in machines.
We know that the kinetic energy of an atom or molecule is calculated by the formula:
K.E. = 1/2 mv2
where m is the mass of the particle and v is its velocity.
When we have to describe the distribution of kinetic energies in a large collection of atoms or molecules, we must resort to statistics. Maxwell and Boltzmann discovered that this distribution may be described by plotting the fraction of molecules in a container with a given kinetic energy vs. kinetic energy. Alternately, we can plot the probability that gas molecules will have a given kinetic energy vs. kinetic energy. This latter plot is depicted below"
Notice that the plot is not symmetric so the most probable kinetic energy is not the same as the average kinetic energy.
Temperature
Temperature is directly proportional to the average kinetic energy of molecules, and, in fact, the equation:
K.E. = 3/2 nRT
where n is the number of moles of gas, T is the temperature in Kelvin, and R is the gas law constant usually expressed in units of 1.98 cal/deg mole. (You are probably used to seeing R as 0.0821 liters atm/mole deg C which are the units usually used in the gas laws.)
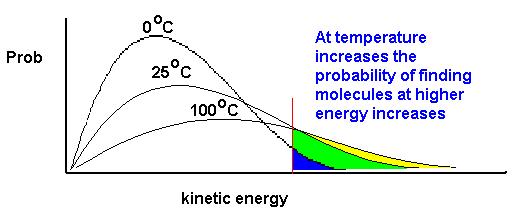
If T is proportional to the average kinetic energy, then we'd expect for this change in the average kinetic energy to be reflected in changes in the shape of the Boltzmann distribution. Since in our example we're using probability on the vertical axis, the area under the curve must be exactly equal to 1.0 at all times (there must be a unit probability of the gas having some kinetic energy). As temperature increases, the curve will spread to the right and the value of the most probable kinetic energy will decrease. This is illustrated below for several temperatures.

It is often useful to fix our attention on some value of the kinetic energy and ask what happens to the fraction of molecules with kinetic energies equal to or greater than this value as we change the temperature. Let's reexamine the curves from above with this in mind. These curves are illustrated below. I have selected a reference kinetic energy in Red. Notice that as T increases, the fraction of molecules with energies greater than the red line increase. This fact is of fundamental importance to properties of matter such as vapor pressures, and we will see that these ideas underlie the effect of temperature on the rates of chemical processes. Whenever a question arises about the effect of temperature on some chemical process, you should refer back to the Maxwell-Boltzmann concepts.
Source: http://neon.chem.uidaho.edu/~honors/boltz.html