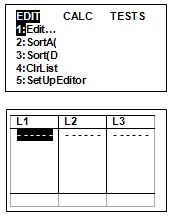
Standard deviation

The standard deviation is a measure of the variation of the results. For data that is evenly distributed each side of the mean (a normal distribution) 68% of the data lies within one standard deviation of the mean.

You can work this out on your TI 83 plus calculator as follows:

Use the key

Press

This gives you the STAT menu.

You will already be in the EDIT menu. Press

This opens a spread sheet

You can see if there is anything stored in the columns of the spread sheet. Check this and if there are data you need to clear it.

To clear the spread sheet

Press
You will be in the EDIT menu. Press
You will get “ClrList
Press
then

You have now cleared column L1
Repeat the process (
,
, , , etc….) to clear the other columns

To enter data

Press
You will be in the EDIT menu.
Select

This opens a spread sheet
type in the first number, then

second number then
etc

If you are comparing two sets of data do the same thing in column L2

To find out mean, median, standard deviation and more besides!

Press
Use the cursor to move across to the CALC menu
You will find a menu which permits you to calculate a large number of statistical parameters. Most of what we want is in
1:1-Var Stats. The first on the list.
Press

1-Var Stats
appears
Press
then and

You will get:

(the mean)

Sx (the standard deviation of the sample)

(the standard deviation of a population)

n (the number in the sample)

Scroll down for more!

minX (the minimum value)
Q1 (the first quartile)
Med (the median)
Q3  (the third quartile)
maxX (the maximum value)